Artifact Overview of Tzer (OOPSLA’22)#
![]()
![]()
![]()
![]()

![]()

![]()
For best reading experience, you are highly recommended to view this overview on your web browser.
Get Started#
Prerequisites
OS: A Linux System with Docker Support;
Hardware: X86 CPU; 8GB RAM; 256GB Storage; Good Network to GitHub and Docker Hub;
Before you start, please make sure you have Docker installed.
# Test docker availability
sudo docker --version
# Output looks like: (no error)
# Docker version 20.10.12, build e91ed5707e
Otherwise please follow the installation page of Docker.
Quick Start with Docker#
# Pull docker image from docker hub;
sudo docker run -it --name tzer-artifact tzerbot/oopsla
# By using this command, you will "get into" the image like entering a virtual machine.
# The session will be kept under the name "tzer-artifact"

# Inside the image;
cd tzer
python3 src/main_tir.py   --fuzz-time 3     --report-folder quick-start-report
#                         run for 3 min.    bugs in folder `quick-start-report`
After a successful installation, commands above run for 3 minutes and print something like:
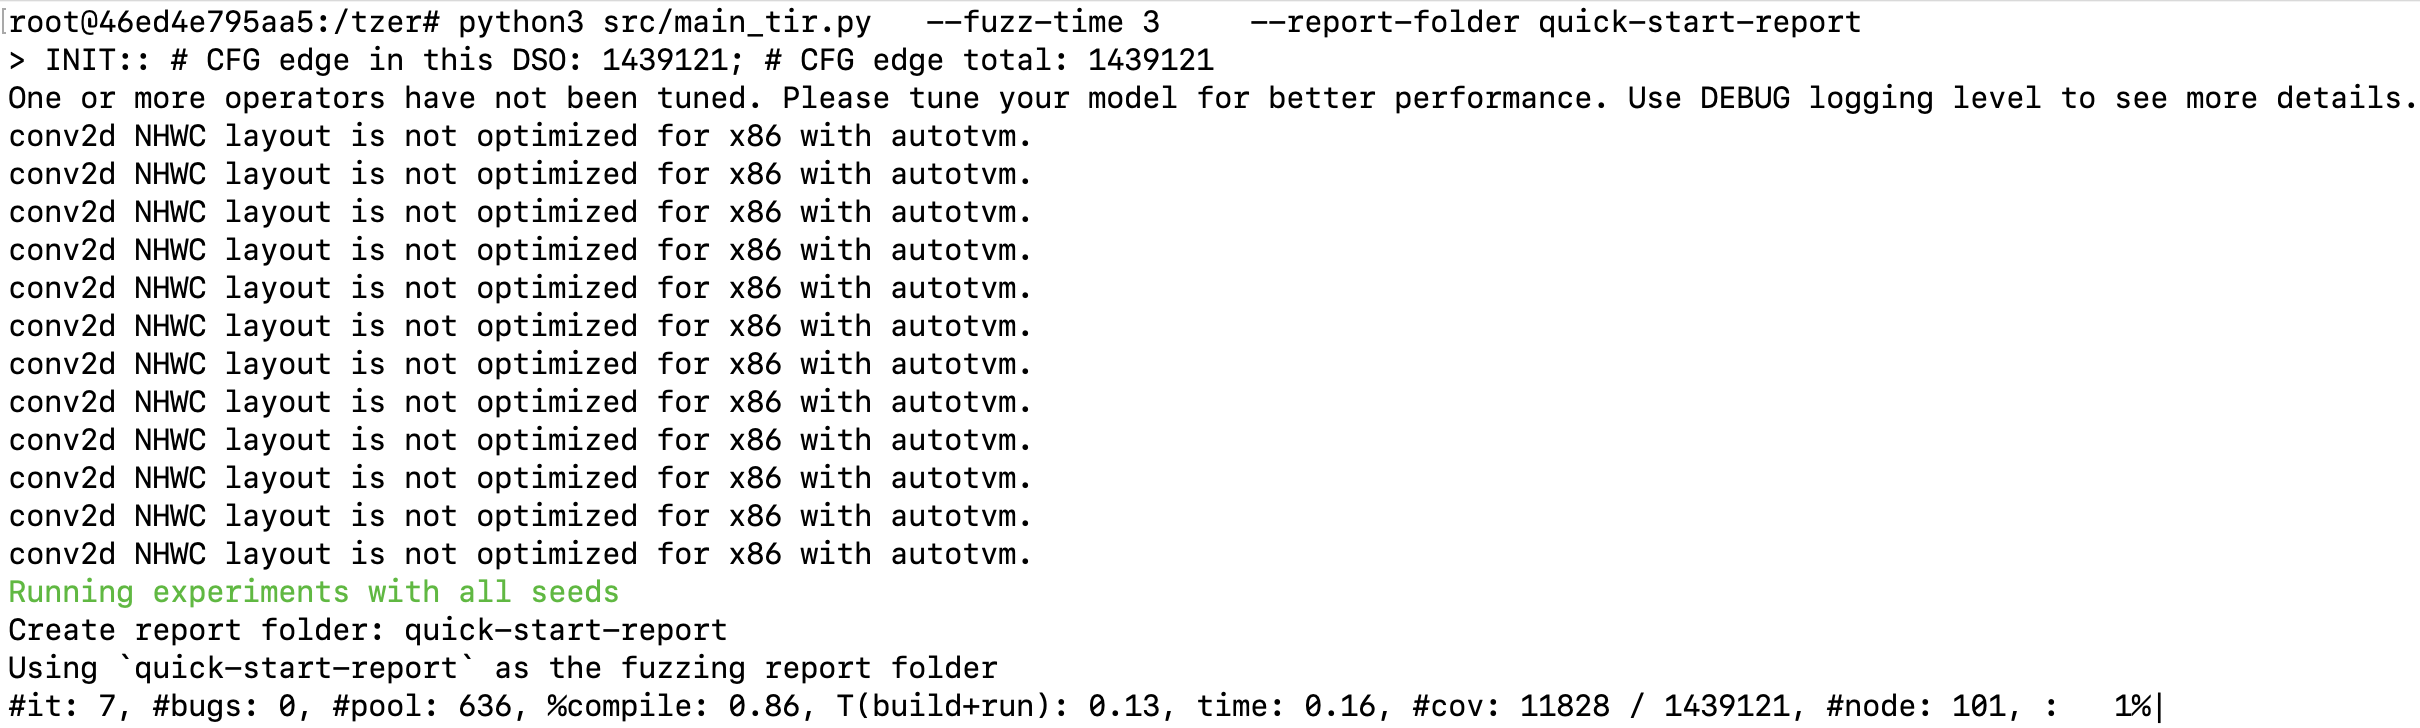
Output files are stored in quick-start-report (parameter of --report-folder):
Note
You are safe to exit and re-enter the container. For example, here is how you exit the container and copy some files from it.
# Make sure you have the following step already executed (re-executing it will bring errors).
# sudo docker run -it --name tzer-artifact tzerbot/oopsla

# -- Inside the container.
touch /tzer/foo.txt    # Create a dummy file.
exit                   # Exit the container.
# --

# -- Outside the container.
# Copy the file called `/tzer/foo.txt` from the container:
sudo docker cp tzer-artifact:/tzer/foo.txt .
ls foo.txt             # `foo.txt` is now on your host system.

# resume the container:
sudo docker start -a -i tzer-artifact
# --
Explanation of parameters and file names#
Report folder contents
cov_by_time.txt: a csv file where columns means “time” (second) and edge coverage;valid_seed_new_cov_count.txt: number of generated valid tests with new coverage;${BUG_TYPE}_${BUG_ID}.error_message.txt: error message snapshot of failures;${BUG_TYPE}_${BUG_ID}.ctx: context data to reproduce bugs (stored in Pickle)meta.txt: metadata including git version of TVM and experiment time;tir_by_time.pickle: generated <F, P> (i.e., TIR and Passes) files (ifTIR_REC=1is set);
Main commandline options
Commandline options (added as the tail of commands):
--fuzz-time: Time budget of fuzzing (minute);--tolerance: Parameter $N_{max}$ in the paper (control the interleaving of IR and pass mutation);--report-folder: Path to store results (e.g., coverage trend);
Environment variables to control the algorithm options (added the prefix of commands):
PASS=1to enable pass mutation;NO_SEEDS=1to disable initial seeds (start from an empty function);LEMON=1to use LEMON seeds instead of Tzer’s seeds;NO_COV=1to disable the coverage feedback;TIR_REC=1to record generated TIR files (for evaluating non-coverage version);
Step by Step Instructions#
In this section, we provide step-by-step instructions to reproduce results in our paper. Notably, the original data used in our paper (along with the visualization scripts) is also released in our GitHub repo (the paper_data folder).
Evidence 1: Bug Finding (15 minutes)#
(Abstract) “To date, Tzer has detected 40 previously unknown bugs for TVM, with 30 bugs confirmed and 24 bugs fixed (PR merged).”
Claim 1.1: The total 40 bugs
Reproducing these bugs requires GPU environments and retrieving to the initial git commit when we started our bug finding. To ease the effort of reviewers, we set up a cloud environment in Colab to reproduce the bugs in your browser remotely. To reproduce the bugs, open the Colab LINK in your browser and follow the instructions to set up the GPU environment and reproduce the bugs with a simple click on your mouse. :-)
Claim 1.2: 30 confirmed and 24 fixed
We compiled the confirmed bug under the Google Sheet LINK. Trackable links to PR/Bug reports are listed in the Google Sheet. Note that more than 1 bug might be included for one PR/Issue link.
Evidence 2: RQ1 - Comparison with Existing Work (18 minutes)#
We list steps to reproduce results in Section 5.1 (i.e., Figure 5 and Table 2).
Figure 5 and Table 2 (18 minutes)#
Randomness in Experiments
Note that there will be randomness in fuzzing given different system performance and random seeds. This means detailed reproduced data might not be strictly equivalent to that presented in the paper, but the overall trend should be consistent in the long run (say 4 hours).
Minimal and Full Experiments
In our paper, all fuzzing experiments except Figure 10 run for 4 hours.
To ease the effort of artifact evaluation, the following minimal experiments will run for 3 minutes by default.
To conduct the full experiments, please replace the command line argument --fuzz-time 3 with --fuzz-time 240.
For instance of claim 2.1:
cd /tzer
#                               quick experiment: 3   minutes
PASS=1 LOW=1 python3 src/main_tir.py   --fuzz-time 3     --report-folder tzer-tzer-seed --tolerance 4
#                               full experiment:  240 minutes
PASS=1 LOW=1 python3 src/main_tir.py   --fuzz-time 240   --report-folder tzer-tzer-seed --tolerance 4
Figure 5 and Table 2 can be reproduced under the same batch of experiments. There will be 5 sub-experiments for different fuzzers. For each experiment, the output is in the report folder.
Under the report folder, 2 files are relevant:
cov_by_time.txt: for each it represents elapsed time (in seconds) and coverage split by “,”;In
valid_seed_new_cov_count.txt, the number represents the total number of valuable tests (initial seeds not taken into account);
Claim 2.1: Result of “Tzer” in Fig. 5 and Tab. 2
report folder:
/tzer/tzer-tzer-seedexpected time: 3 minutes
to reproduce:
# In the container
cd /tzer
PASS=1 LOW=1 python3 src/main_tir.py --fuzz-time 3 --report-folder tzer-tzer-seed --tolerance 4
Claim 2.2: Result of “Tzer (LEMON seeds)” in Fig. 5 and Tab. 2
report folder:
/tzer/tzer-lemon-seedexpected time: 3 minutes
to reproduce:
# In the container
cd /tzer
LEMON=1 PASS=1 LOW=1 python3 src/main_tir.py --fuzz-time 3 --report-folder tzer-lemon-seed --tolerance 4
Claim 2.3: Result of “LEMON” in Fig. 5 and Tab. 2
report folder:
/tzer/lemonexpected time: 3 minutes
to reproduce:
Note
Directly using LEMON to generate DL models from scratch is complicated and the massive amount of generated models may consume disk spaces at TB level. It also requires further dirty edits to make LEMON’s docker image work.
LEMON generates Keras models (hundreds of Gigabytes and even over 1 Terabyte) in 4 hours. To evaluate it under TVM, we also need to covert these Keras models into TIR files. To ease the reproduction procedures, we directly provide the minimized valuable TIR files converted from LEMON in /tzer/lemon_results (inside the container).
# In the container
cd /tzer
python3 src/get_cov_lemon.py --report-folder lemon --result-folder=/tzer/lemon_results --timeout=180 # for full result: use `--timeout 14400`
Claim 2.4: Result of “LibFuzzer” in Fig. 5 and Tab. 2
report folder:
/tzer/libfuzzexpected time: 3 minutes
to reproduce:
# In the container
cd /tzer/tvm_cov_patch/tvm-libfuzz/build
python3 run_libfuzz.py -t 180  # for full 4-hour experiment: use `-t 14400`
cd /tzer
python3 src/get_cov_libfuzz.py --report-folder libfuzz --build-folder /tzer/tvm_cov_patch/tvm-libfuzz/build
Claim 2.5: Result of “TVMFuzz” in Fig. 5 and Tab. 2
report folder:
/tzer/tvm-fuzzexpected time: 6 minutes
to reproduce:
Note
This experiment requires doubled evaluation time (3 x 2 = 6 minutes). As is specified in Section 4.5 of our paper, TVMFuzz requires no coverage support so we first run TVMFuzz on non-instrumented TVM binary (for best performance and fairness) and we then evaluate TVMFuzz’s output TIR files on instrumented binary.
# In the container
cd /tzer/TVMFuzz
# Run TVMFuzz on non-instrumented TVM
TVM_HOME=/tzer/tvm_cov_patch/tvm-no-cov PYTHONPATH=/tzer/tvm_cov_patch/tvm-no-cov/python python3 src/main_tvmfuzz.py --fuzz-time 3 --report-folder tvm-fuzz
# Replay the TIR files on instrumented TVM
TVM_HOME=/tzer/tvm_cov_patch/tvm PYTHONPATH=/tzer/tvm_cov_patch/tvm/python python3 src/get_cov.py --folders tvm-fuzz --timeout 2
cd /tzer
mv /tzer/TVMFuzz/tvm-fuzz ./
Result Visualization
To visualize the results:
# Inside the container
cd /tzer
# python3 src/plot_cov.py -f [list of report-folders] -cl [y-axis bias]
python3 src/plot_cov.py -f tzer-tzer-seed tzer-lemon-seed lemon libfuzz tvm-fuzz -cl 5000
The figure is now available at /tzer/cov.png (inside the container).
You can view it by copying it from the container to the host system.
# Inside the container
exit

# Outside the container (host)
sudo docker cp tzer-artifact:/tzer/cov.png .
ls cov.png # You get the file; please view it by double-clicking it on your host system.

# To re-enter the container:
sudo docker start -a -i tzer-artifact
Opening cov.png, you would see something like:
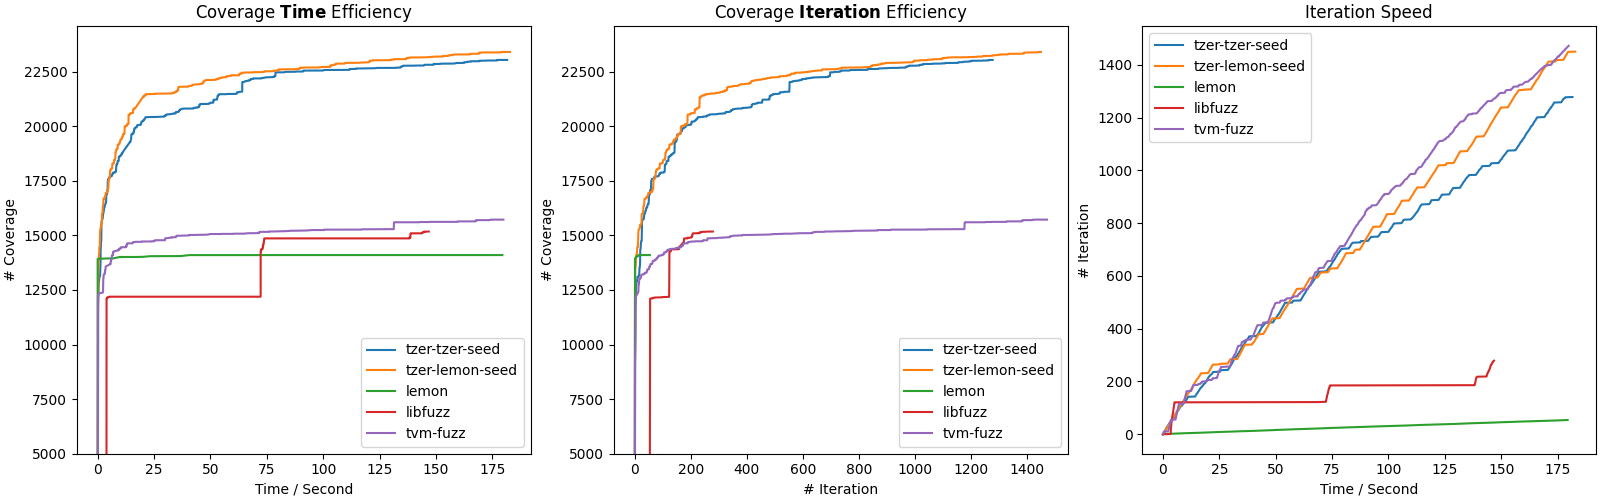
There are three subplots in this figure:
Coverage Time Efficiency shows the coverage that different methods can achieve within the same amount of time (measured in seconds).
Coverage Iteration Efficiency shows the coverage that different methods can achieve with the same number of generated test cases. This indicates the quality of generated test samples for each method.
Iteration Speed indicates how fast a method generates new test cases.
Coverage Iteration Efficiency and Iteration Speed are inapplicable to lemon and libfuzz
Coverage Iteration Efficiency and Iteration Speed are not applicable to lemon and libfuzz as their implementations only record test samples that contribute to new coverage making them look flat in these 2 figures.
The first subfigure (Coverage Time Efficiency) depicts the coverage curves used in Figure 5. The file called valid_seed_new_cov_count.txt under the report folder contains the number of valuable tests.
Evidence 3: RQ2 - Ablation Study (15 minutes)#
We list steps to reproduce results in Section 5.2 (i.e., Figure 6).
Figure 6 (15 minutes)#
Randomness in Experiments
Note that there will be randomness in fuzzing given different system performance and random seeds. This means detailed reproduced data might not be strictly equivalent to that presented in the paper, but the overall trend should be consistent in the long run (say 4 hours).
Specifically, as the minimal experiments only run fuzzers for 3 minutes, the coverage trend superiority for claim 3.4 and claim 3.5 can be randomized.
Minimal and Full Experiments
In our paper, all fuzzing experiments except Figure 10 run for 4 hours.
To ease the effort of artifact evaluation, the following minimal experiments will run for 3 minutes by default.
To conduct the full experiments, please replace the command line argument --fuzz-time 3 with --fuzz-time 240.
Claim 3.1: Result of “(1): General IR Mut. (No Cov.)” in Fig. 6
report folder:
/tzer/ablation-1expected time: 6 minutes
to reproduce:
# in the docker image
cd /tzer
TVM_HOME=$TVM_NO_COV_HOME PYTHONPATH=$TVM_HOME/python TIR_REC=1 NO_COV=1 python3 src/main_tir.py --fuzz-time 3 --report-folder ablation-1
python3 src/get_cov.py --folders ablation-1 # Evaluate samples on instrumented TVM to get coverage results.
Claim 3.2: Result of “(2): (1) + Cov. Guidance” in Fig. 6
report folder:
/tzer/ablation-2expected time: 3 minutes
to reproduce:
# in the docker image
cd /tzer
python3 src/main_tir.py --fuzz-time 3 --report-folder ablation-2
Claim 3.3: Result of “(3): (2) + Domain-Specific IR Mutation” in Fig. 6
report folder:
/tzer/ablation-3expected time: 3 minutes
to reproduce:
# in the docker image
cd /tzer
LOW=1 python3 src/main_tir.py --fuzz-time 3 --report-folder ablation-3
Claim 3.4: Result of “(4): (3) + Random Pass Mutation” in Fig. 6
report folder:
/tzer/ablation-4expected time: 3 minutes
to reproduce:
# in the docker image
cd /tzer
PASS=1 RANDOM_PASS=1 LOW=1 python3 src/main_tir.py --fuzz-time 3 --report-folder ablation-4
Claim 3.5: Result of “(5): (3) + Evolutionary IR-Pass Mutation” in Fig. 6
This experiment can reuse
/tzer/tzer-tzer-seed(Claim 2.1) for Figure 5.report folder:
/tzer/ablation-5<-/tzer/tzer-tzer-seed
# in the docker image
cp -r /tzer/tzer-tzer-seed /tzer/ablation-5
Result Visualization
To visualize the results:
# Inside the container
cd /tzer
python3 src/plot_cov.py -f ablation-1 ablation-2 ablation-3 ablation-4 ablation-5 -cl 18000
The figure is now available at /tzer/cov.png (inside the container).
You can view it by copying it from the container to the host system.
# Inside the container
exit

# Outside the container (host)
sudo docker cp tzer-artifact:/tzer/cov.png .
ls cov.png # You get the file; please view it by double-clicking it on your host system.

# To re-enter the container:
sudo docker start -a -i tzer-artifact
Opening cov.png, you would see something like:
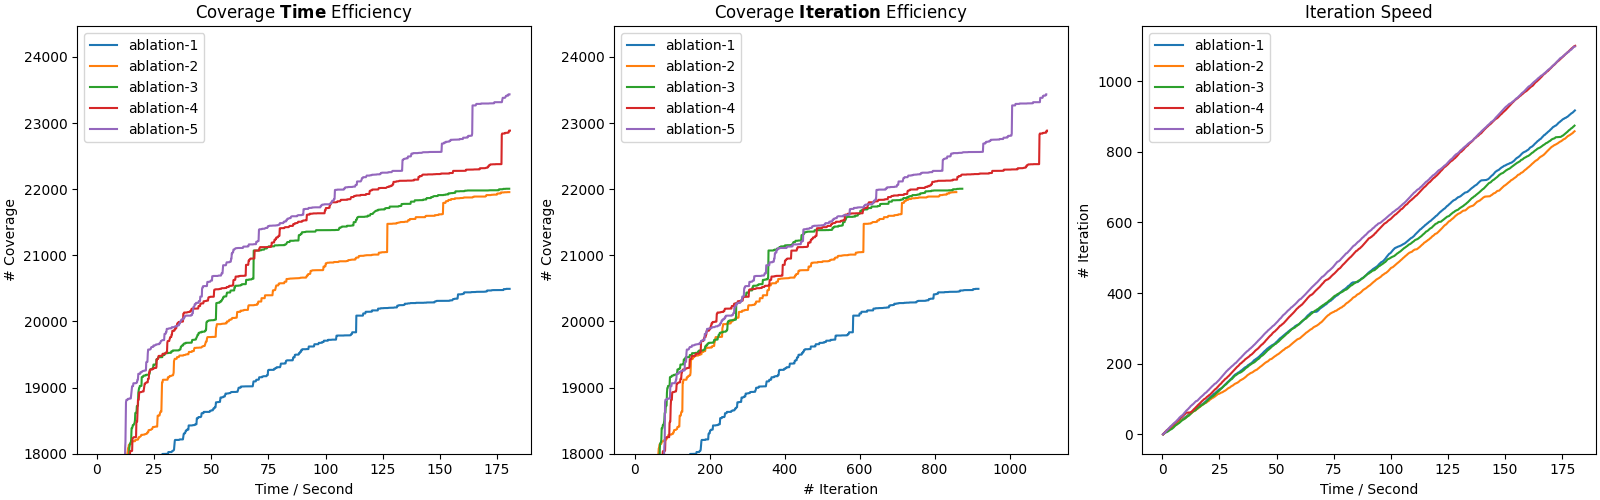
The first subfigure (Coverage Time Efficiency) depicts the coverage curves used in Figure 6.
Evidence 4: RQ3 - Parameter Sensitivity (34 minutes)#
We list steps to reproduce results in Section 5.3 (i.e., Figure 7, 8, 9).
Randomness in Experiments
Note that there will be randomness in fuzzing given different system performance and random seeds. This means detailed reproduced data might not be strictly equivalent to that presented in the paper, but the overall trend should be consistent in the long run (say 4 hours).
Minimal and Full Experiments
In our paper, all fuzzing experiments except Figure 10 run for 4 hours.
To ease the effort of artifact evaluation, the following minimal experiments will run for 3 minutes by default.
To conduct the full experiments, please replace the command line argument --fuzz-time 3 with --fuzz-time 240.
Figure 7 (5 minutes)#
Tzer without seeds
Claim 4.1: Result of “Tzer without Seeds” in Fig. 7
report folder:
/tzer/tzer-without-seedexpected time: 3 minutes
to reproduce:
# In the container
cd /tzer
NO_SEEDS=1 PASS=1 LOW=1 python3 src/main_tir.py --fuzz-time 3 --report-folder tzer-without-seed --tolerance 4
Claim 4.2: Result of “Tzer with Seeds” in Fig. 7
This experiment can reuse
/tzer/tzer-tzer-seed(Claim 2.1) for Figure 5.report folder:
/tzer/tzer-with-seed<-/tzer/tzer-tzer-seed
# in the docker image
cp -r /tzer/tzer-tzer-seed /tzer/tzer-with-seed
Result Visualization
To visualize the results:
# Inside the container
cd /tzer
python3 src/plot_cov.py -f tzer-with-seed tzer-without-seed -cl 15000
The figure is now available at /tzer/cov.png (inside the container).
You can view it by copying it from the container to the host system.
# Inside the container
exit

# Outside the container (host)
sudo docker cp tzer-artifact:/tzer/cov.png .
ls cov.png # You get the file; please view it by double-clicking it on your host system.

# To re-enter the container:
sudo docker start -a -i tzer-artifact
Opening cov.png, you would see something like:
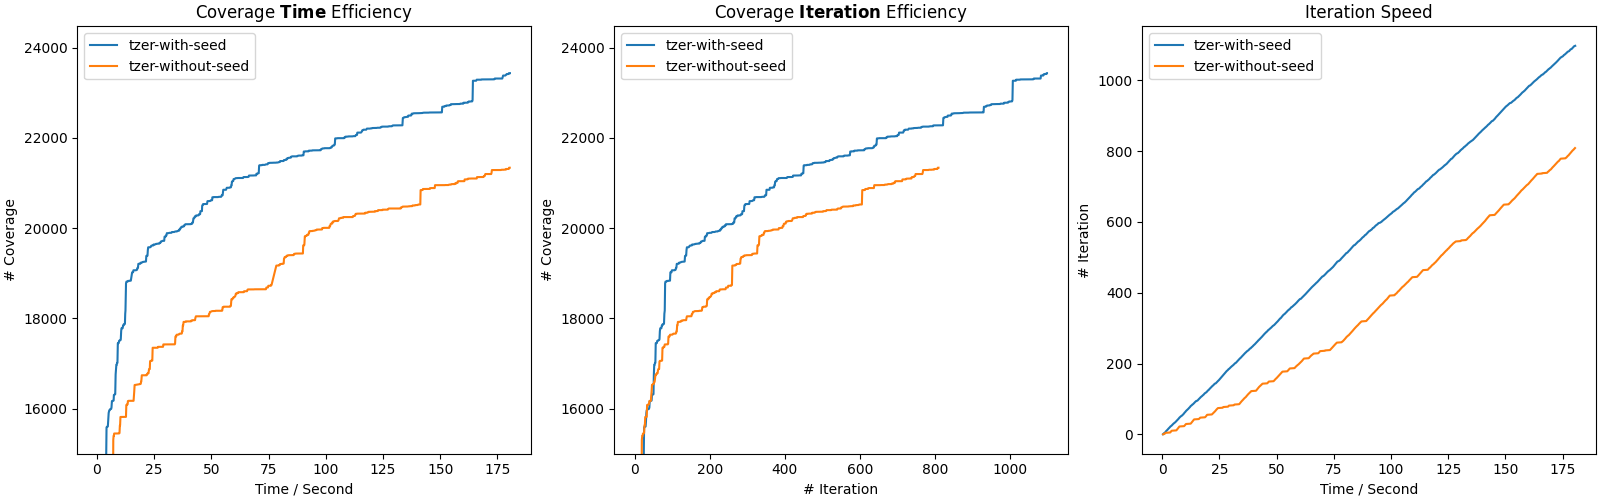
The 3 subfigures present results used in Figure 7.
Figure 8 and 9 (29 minutes)#
Claim 4.3: Results of different $N_{max}$ in Fig. 8 and 9
The value of argument --tolerance represents $N_{max}$ in the paper.
To run $N_{max}$ from 1 to 10 (each of them costs 3 minutes except the reused one):
# Inside the container:
cd /tzer
PASS=1 LOW=1 python3 src/main_tir.py --fuzz-time 3 --report-folder tolerance-1 --tolerance 1
PASS=1 LOW=1 python3 src/main_tir.py --fuzz-time 3 --report-folder tolerance-2 --tolerance 2
PASS=1 LOW=1 python3 src/main_tir.py --fuzz-time 3 --report-folder tolerance-3 --tolerance 3
cp -r /tzer/tzer-tzer-seed /tzer/tolerance-4 # reuse `/tzer/tzer-tzer-seed` from experiments for Fig. 5.
PASS=1 LOW=1 python3 src/main_tir.py --fuzz-time 3 --report-folder tolerance-5 --tolerance 5
PASS=1 LOW=1 python3 src/main_tir.py --fuzz-time 3 --report-folder tolerance-6 --tolerance 6
PASS=1 LOW=1 python3 src/main_tir.py --fuzz-time 3 --report-folder tolerance-7 --tolerance 7
PASS=1 LOW=1 python3 src/main_tir.py --fuzz-time 3 --report-folder tolerance-8 --tolerance 8
PASS=1 LOW=1 python3 src/main_tir.py --fuzz-time 3 --report-folder tolerance-9 --tolerance 9
PASS=1 LOW=1 python3 src/main_tir.py --fuzz-time 3 --report-folder tolerance-10 --tolerance 10
Result Visualization
To visualize the results:
# Inside the container
cd /tzer
python3 src/plot_cov.py -f ./tolerance-* -cl 18000
The figure is now available at /tzer/cov.png (inside the container).
You can view it by copying it from the container to the host system.
# Inside the container
exit

# Outside the container (host)
sudo docker cp tzer-artifact:/tzer/cov.png .
ls cov.png # You get the file; please view it by double-clicking it on your host system.

# To re-enter the container:
sudo docker start -a -i tzer-artifact
Opening cov.png, you would see something like:
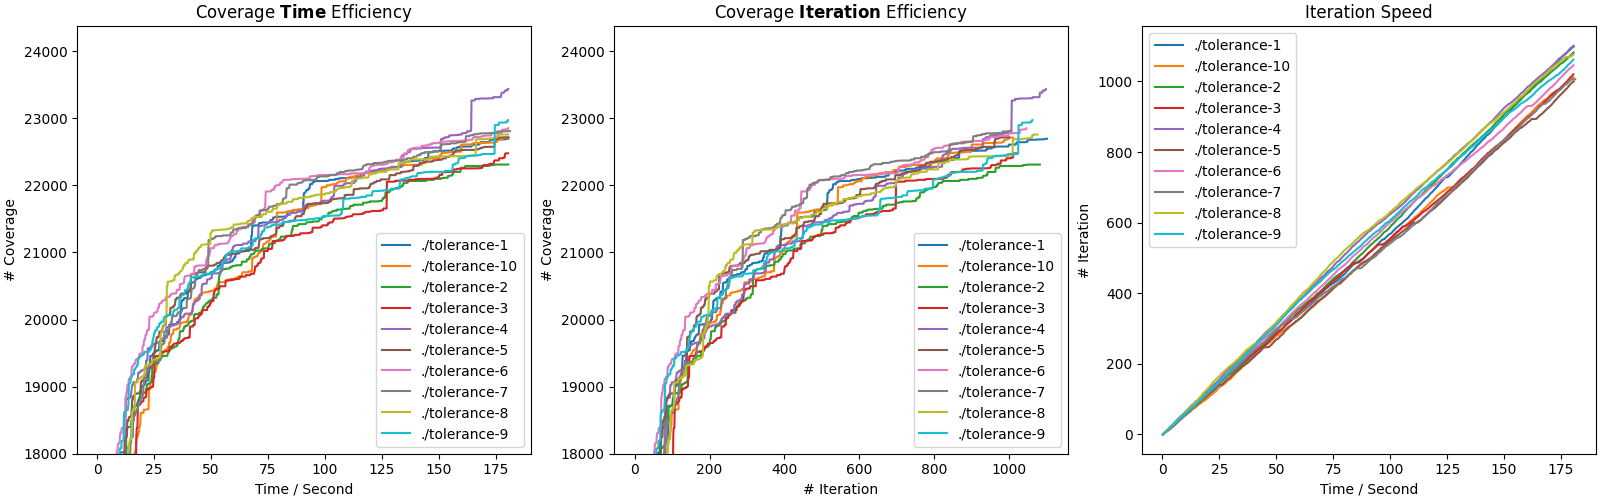
The first subfigure (Coverage Time Efficiency) depicts the coverage curves used in Figure 9. Figure 8 shows the peak coverage of each setting/curve.
Evidence 5: RQ4 - Bug Detection Effectiveness (10 minutes)#
We list steps to reproduce results in Section 5.4 (i.e., Table 4).
Table 4 (10 minutes)#
Claim 5.1: Detectable Valid Bugs in Tab. 4
The classification and detectable bugs are summarised in this link. Columns 5-7 from the Google Sheet specifies detectable bugs by other baselines among all bugs detected by Tzer which justifies column 2-4 in Table 4 of our paper. Column 8 from the Google Sheet indicates the bugs that do not have to be triggered by combinations of passes and IRs. Note that each row in the Google Sheet might represent multiple bugs.
Original Data in the Paper#
We show how to use the original data to reproduce exactly the same figures used in our paper.
Preparation
Before start, please update the repo to get paper_data (original data).
# In the container
cd /tzer
git pull # Make sure the repo is up-to-date
ls paper_data
Plotting original figures in the paper
Figure 5 for RQ1
# In the container
cd /tzer/RQ1
python3 plot_cov.py
The output figure is now available under /tzer/paper_data/RQ1/baseline_cov.{pdf|png}.
Figure 6 for RQ2
# In the container
cd /tzer/RQ2
python3 plot_cov.py
The output figure is now available under /tzer/paper_data/RQ2/ablation_cov.{pdf|png}.
Figure 7 for RQ3
# In the container
cd /tzer/RQ3
python3 plot_cov_seeds.py
The output figure is now available under /tzer/paper_data/RQ3/seeds_complete.{pdf|png}.
Figure 8 for RQ3
# In the container
cd /tzer/RQ3
python3 plot_nmax_bar_x.py
The output figure is now available under /tzer/paper_data/RQ3/nmax_peak.{pdf|png}.
Figure 9 for RQ3
# In the container
cd /tzer/RQ3
python3 plot_nmax.py
The output figure is now available under /tzer/paper_data/RQ3/nmax.{pdf|png}.
Figure 10 for RQ3
# In the container
cd /tzer/RQ3
python3 plot_cov_24h.py
The output figure is now available under /tzer/paper_data/RQ3/24h.{pdf|png}.